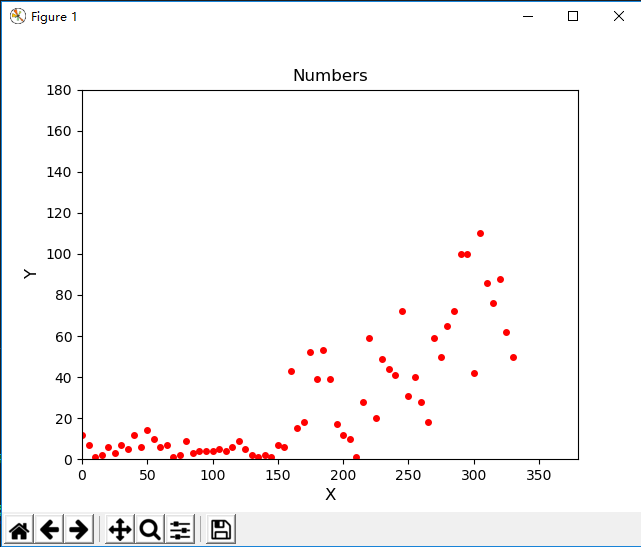
本文实例讲述了Python使用matplotlib模块scatter方法画散点图。分享给大家供大家参考,具体如
本文实例讲述了Python使用matplotlib 模块scatter方法画散点图。分享给大家供大家参考,具体如下:
# -*-coding:utf-8-*-
import matplotlib.pyplot as plt
y = [12, 7, 1, 2, 6, 3, 7, 5, 12, 6, 14, 10, 6, 7, 1, 2, 9, 3, 4, 4, 4, 5, 4, 6, 9, 5, \
 2, 1, 2, 1, 7, 6, 43, 15, 18, 52, 39, 53, 39, 17, 12, 10, 1, 28, 59, 20, 49, \
 44, 41, 72, 31, 40, 28, 18, 59, 50, 65, 72, 100, 100, 42, 110, 86, 76, 88, 62, 50]
print(len(y))
x = []
for i in range(0, len(y)): #x and y must be the same size
 x.append(i*5)
plt.scatter(x, y, s=16, c = 'r',marker = 'o')
#设置标题并加上轴标签
plt.title("Numbers",fontsize=12)
plt.xlabel("X", fontsize=12)
plt.ylabel("Y", fontsize=12)
#设置刻度标记的大小
plt.tick_params(axis='both',which='major',labelsize=10)
#设置每个坐标的取值范围
plt.axis([0,380,0,180])
plt.show()
