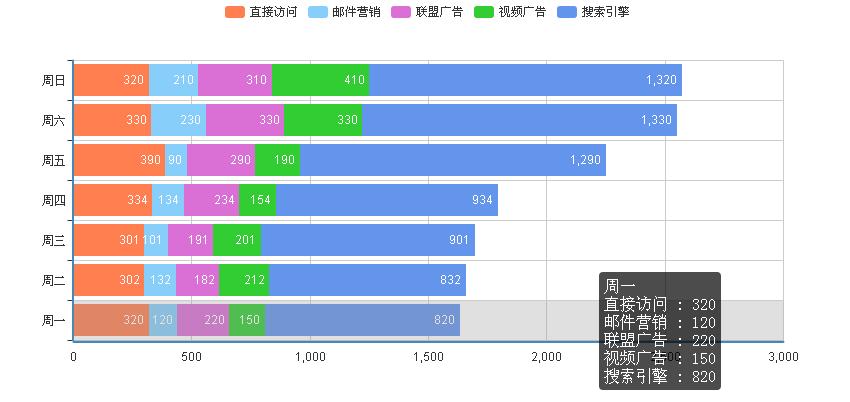
本文实例讲述了利用百度echarts实现图表功能。分享给大家供大家参考,具体如下:
百度有一款开源的图表控件,号称是大数据时代最好的图表控件。刚好目前的项目需要用图表展示给客户看数据,所以就选择这个三方的控件。对这种控件一般来说使用起来应该没有太大的难度,基本就是按照它的规则组装json数据,关键是配置上面, 如果刚开始入门,不太懂,可能真要花点时间来搞的。我整理了一个最基本的入门例子,里面有详细的注释,按这种方式去加载相关 js 就没有问题了:
<!DOCTYPE html>
<head>
 <meta charset="GBK">
 <title>ECharts</title>
</head>
<body>
 <!-- 为ECharts准备一个具备大小(宽高)的Dom -->
 <div id="main" style="height:400px"></div>
 <!-- 功能测试 -->
 <!-- ECharts单文件引入 -->
 <script src="./js/echarts.js"></script>
 <script type="text/javascript">
 // 路径配置
 require.config({
 paths: {
 echarts: './js'
 }
 });
 // 使用
 require(
 [
 'echarts',
 'echarts/chart/bar' // 使用柱状图就加载bar模块,按需加载
 ],
 function (ec) {
 // 基于准备好的dom,初始化echarts图表
 var myChart = ec.init(document.getElementById('main'));
 var option = {
 tooltip : {
 trigger: 'axis',
 axisPointer : { // 坐标轴指示器,坐标轴触发有效
 type : 'shadow' // 默认为直线,可选为:'line' | 'shadow'
 }
 },
 legend: {
 data:['直接访问', '邮件营销','联盟广告','视频广告','搜索引擎']
 },
 toolbox: {
 show : false,
 feature : {
 mark : {show: true},
 dataView : {show: true, readOnly: false},
 magicType : {show: true, type: ['line', 'bar', 'stack', 'tiled']},
 restore : {show: true},
 saveAsImage : {show: true}
 }
 },
 calculable : true,
 xAxis : [
 {
 type : 'value'
 }
 ],
 yAxis : [
 {
 type : 'category',
 data : ['周一','周二','周三','周四','周五','周六','周日']
 }
 ],
 series : [
 {
 name:'直接访问',
 type:'bar',
 stack: '总量',
 itemStyle : { normal: {label : {show: true, position: 'insideRight'}}},
 data:[320, 302, 301, 334, 390, 330, 320]
 },
 {
 name:'邮件营销',
 type:'bar',
 stack: '总量',
 itemStyle : { normal: {label : {show: true, position: 'insideRight'}}},
 data:[120, 132, 101, 134, 90, 230, 210]
 },
 {
 name:'联盟广告',
 type:'bar',
 stack: '总量',
 itemStyle : { normal: {label : {show: true, position: 'insideRight'}}},
 data:[220, 182, 191, 234, 290, 330, 310]
 },
 {
 name:'视频广告',
 type:'bar',
 stack: '总量',
 itemStyle : { normal: {label : {show: true, position: 'insideRight'}}},
 data:[150, 212, 201, 154, 190, 330, 410]
 },
 {
 name:'搜索引擎',
 type:'bar',
 stack: '总量',
 itemStyle : { normal: {label : {show: true, position: 'insideRight'}}},
 data:[820, 832, 901, 934, 1290, 1330, 1320]
 }
 ]
 };
 // 为echarts对象加载数据
 myChart.setOption(option);
 // 根据窗口自动缩放
 window.onresize = myChart.resize;
 // 绑定事件测试
 var ecConfig = require('echarts/config');
 myChart.on(ecConfig.EVENT.CLICK, function(param){
 // 需要的参数都可以从这里面获取.
 alert(param);
 })
 }
 );
 </script>
</body>

整个例子代码下载,包含了百度 echarts包.
完整实例代码点击此处本站下载。