本文实例讲述了jQuery插件FusionCharts实现的3D柱状图效果。分享给大家供大家参考,具体如下:
1、实现源码:
<!DOCTYPE html>
<html>
<head>
<meta charset="UTF-8">
<title>FusionCharts3D柱状图</title>
<script src="js/jquery-1.4.2.min.js"></script>
<script type="text/javascript" src="js/fusioncharts.js" ></script>
<style>
body,html{
width:99%;
height: 98%;
font-family: "arial rounded mt bold";
font-size: 12px;
}
</style>
<script>
$(document).ready(function(){
FusionCharts.ready(function () {
var column3DChart = new FusionCharts({
type: 'column3d',
renderAt: 'column3D',
width: '1350',
height: '650',
dataFormat: 'json',
dataSource: {
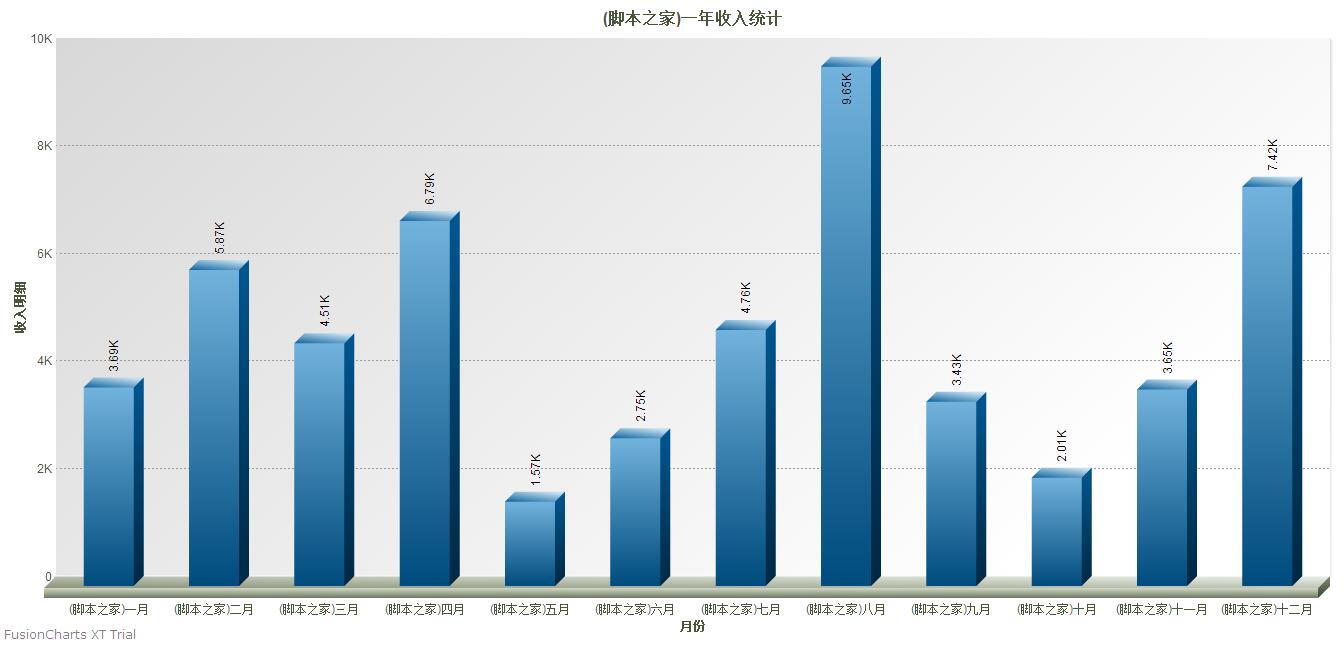
"chart": {
"caption": "(脚本之家)一年收入统计",
"xAxisName": "月份",
"yAxisName": "收入明细",
"paletteColors": "#0075c2",
"valueFontColor": "#000000",
"baseFont": "Helvetica Neue,Arial",
"captionFontSize": "16",
"subcaptionFontSize": "16",
"subcaptionFontBold": "1",
"placeValuesInside": "0",
"rotateValues": "1",
"showShadow": "0",
"divlineColor": "#999999",
"divLineIsDashed": "1",
"divlineThickness": "1",
"divLineDashLen": "1",
"divLineGapLen": "1",
"canvasBgColor": "#ffffff"
},
"data": [
{
"label": "(脚本之家)一月",
"value": "3689"
},
{
"label": "(脚本之家)二月",
"value": "5874"
},
{
"label": "(脚本之家)三月",
"value": "4512"
},
{
"label": "(脚本之家)四月",
"value": "6785"
},
{
"label": "(脚本之家)五月",
"value": "1568"
},
{
"label": "(脚本之家)六月",
"value": "2745"
},
{
"label": "(脚本之家)七月",
"value": "4758"
},
{
"label": "(脚本之家)八月",
"value": "9652"
},
{
"label": "(脚本之家)九月",
"value": "3425"
},
{
"label": "(脚本之家)十月",
"value": "2014"
},
{
"label": "(脚本之家)十一月",
"value": "3652"
},
{
"label": "(脚本之家)十二月",
"value": "7421"
}
]
}
});
column3DChart.render();
});
});
</script>
</head>
<body>
<div id="column3D"></div>
</body>
</html>
2、实现效果图:
附:完整实例代码点击此处本站下载。