本文实例讲述了jQuery插件HighCharts绘制2D柱状图、折线图和饼图的组合图效果。分享给大家供大家参考,具体如下:
1、实例代码:
<!DOCTYPE html>
<html>
<head>
<meta charset="UTF-8">
<title>HighCharts 2D柱状图、折线图和饼图的组合图</title>
<script type="text/javascript" src="js/jquery-1.7.2.min.js"></script>
<script type="text/javascript" src="js/highcharts.js"></script>
<script type="text/javascript">
$(function(){
$('#columnLinePieChart').highcharts({
chart: {
},
title: {
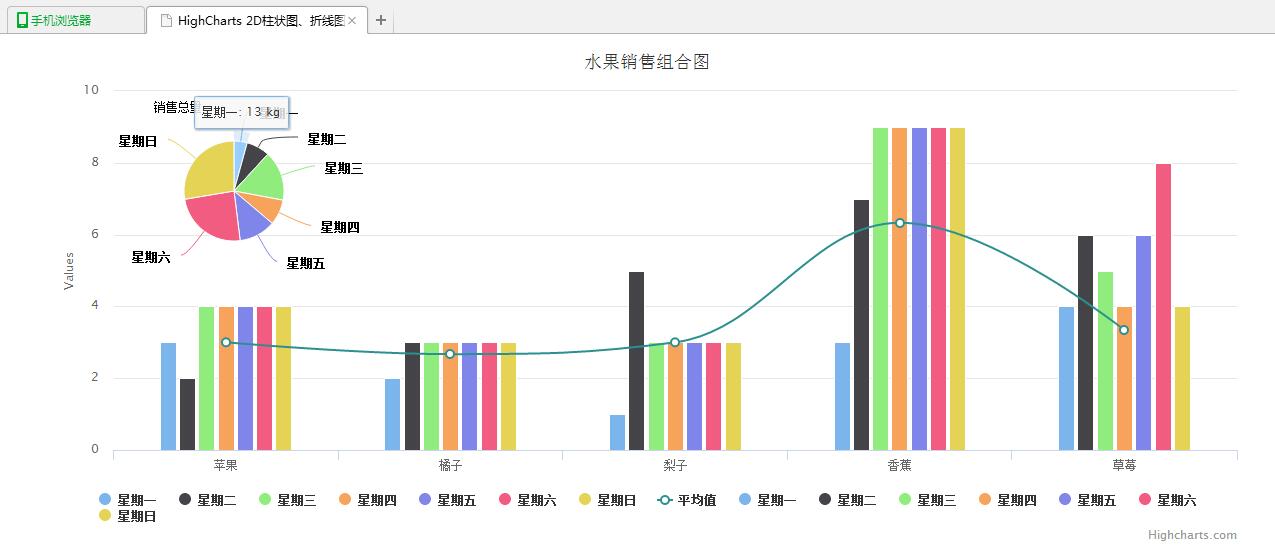
text: '水果销售组合图'
},
xAxis: {
categories: ['苹果', '橘子', '梨子', '香蕉', '草莓']
},
tooltip: {
formatter: function() {
var s;
if (this.point.name) {
s = ''+
this.point.name +': '+ this.y +' kg';
} else {
s = ''+
this.x +': '+ this.y;
}
return s;
}
},
labels: {
items: [{
html: '销售总量',
style: {
left: '40px',
top: '8px',
color: 'black'
}
}]
},
series: [{
type: 'column',
name: '星期一',
data: [3, 2, 1, 3, 4]
}, {
type: 'column',
name: '星期二',
data: [2, 3, 5, 7, 6]
}, {
type: 'column',
name: '星期三',
data: [4, 3, 3, 9, 5]
}, {
type: 'column',
name: '星期四',
data: [4, 3, 3, 9, 4]
},{
type: 'column',
name: '星期五',
data: [4, 3, 3, 9, 6]
},{
type: 'column',
name: '星期六',
data: [4, 3, 3, 9, 8]
},{
type: 'column',
name: '星期日',
data: [4, 3, 3, 9, 4]
},{
type: 'spline',
name: '平均值',
data: [3, 2.67, 3, 6.33, 3.33],
marker: {
lineWidth: 2,
lineColor: Highcharts.getOptions().colors[7],
fillColor: 'white'
}
}, {
type: 'pie',
name: '销售比例',
data: [{
name: '星期一',
y: 13,
color: Highcharts.getOptions().colors[0]
}, {
name: '星期二',
y: 23,
color: Highcharts.getOptions().colors[1]
}, {
name: '星期三',
y: 49,
color: Highcharts.getOptions().colors[2]
}, {
name: '星期四',
y: 25,
color: Highcharts.getOptions().colors[3]
}, {
name: '星期五',
y: 36,
color: Highcharts.getOptions().colors[4]
}, {
name: '星期六',
y: 74,
color: Highcharts.getOptions().colors[5]
}, {
name: '星期日',
y: 84,
color: Highcharts.getOptions().colors[6]
}],
center: [100, 80],
size: 100,
showInLegend: true,
dataLabels: {
enabled: true
}
}]
});
});
</script>
</head>
<body>
<div id="columnLinePieChart" style="width: 1200px; height: 500px; margin: 0 auto"></div>
</body>
</html>
2、运行效果图:
附:完整实例代码点击此处本站下载。