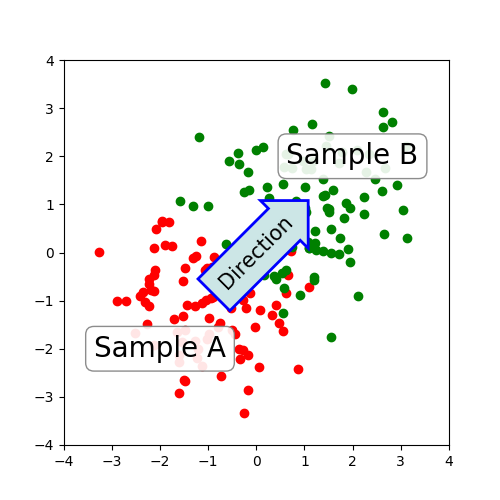
注释文本箭头
结果展示:

完整代码示例:
import numpy as np
import matplotlib.pyplot as plt

fig, ax = plt.subplots(figsize=(5, 5))
ax.set_aspect(1)

x1 = -1 + np.random.randn(100)
y1 = -1 + np.random.randn(100)
x2 = 1. + np.random.randn(100)
y2 = 1. + np.random.randn(100)

ax.scatter(x1, y1, color="r")
ax.scatter(x2, y2, color="g")

bbox_props = dict(boxstyle="round", fc="w", ec="0.5", alpha=0.9)
ax.text(-2, -2, "Sample A", ha="center", va="center", size=20,
 bbox=bbox_props)
ax.text(2, 2, "Sample B", ha="center", va="center", size=20,
 bbox=bbox_props)


bbox_props = dict(boxstyle="rarrow", fc=(0.8, 0.9, 0.9), ec="b", lw=2)
t = ax.text(0, 0, "Direction", ha="center", va="center", rotation=45,
 size=15,
 bbox=bbox_props)

bb = t.get_bbox_patch()
bb.set_boxstyle("rarrow", pad=0.6)

ax.set_xlim(-4, 4)
ax.set_ylim(-4, 4)

plt.show()
总结
以上就是本文关于python matplotlib 注释文本箭头简单代码示例的全部内容,希望对大家有所帮助。感兴趣的朋友可以继续参阅本站:
《matplotlib绘制动画代码示例》
《python+matplotlib绘制简单的海豚(顶点和节点的操作)》
《Python通过matplotlib画双层饼图及环形图简单示例》
如有不足之处,欢迎留言指出。感谢朋友们对本站的支持!